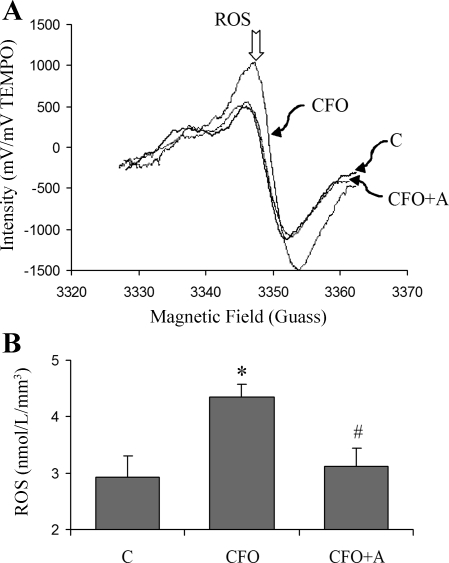
Fig. 3.
A: representative samples of the EPR spectra. The concentration of ROS is proportional to the signal intensity. B: ROS concentration by EPR spectroscopy using the PBN as a spin trap in HEPE-PSS. *Significant difference compared with control (P < 0.05). #Significant difference compared with CFO (P < 0.05).

