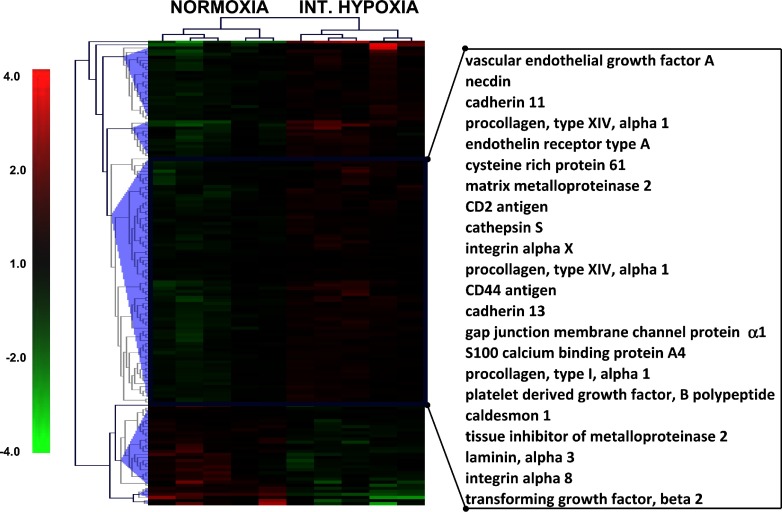
Fig. 7.
Hierarchical clustering of genes representing cell movement pathway. The 151 genes that represent cell movement pathway as identified by Ingenuity analysis (Supplemental Fig. S1) were clustered using default settings of MeV software. Expression difference values (log2) for each gene were calculated by subtracting the average of expression values of a given gene in all tested conditions from individual gene expression value of each biological replicate. Each column represents an experimental condition of lung sample, and each row represents expression pattern of a gene throughout given experimental conditions. Hierarchical clustering conducted using Euclidian correlation (average linkage) identified 5 major clusters (blue triangles), of which 1 cluster demonstrated clear upregulation after IH. Genes from these clusters are highlighted with a blue rectangle, and the most representative are listed on the right. Red color indicates upregulation, and green color indicates downregulation of gene expression relative to combined average, with color intensity corresponding to the expression difference (scale is shown on the left).

