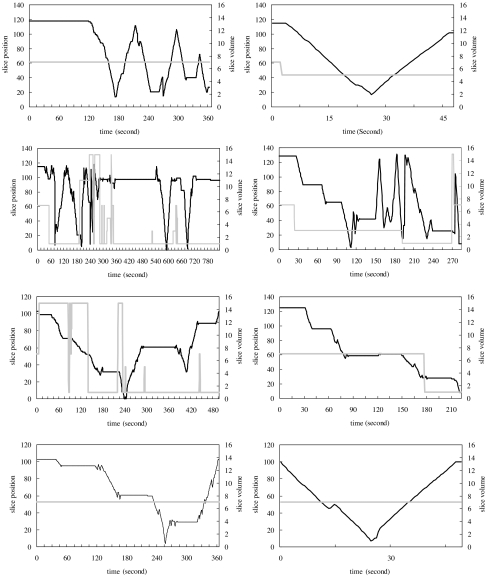
Fig 1.
Navigation patterns from four radiologists in stereo mode. Each graph is the navigation recorded from one case interpretation. Two graphs in each row are taken from one radiologist’s interpretations in the beginning of the study (left) and the end of the study (right). The dark solid line represents viewing positions referenced to the scale on the left axis, and the gray solid line represents viewing thickness referenced to the scale on the right axis, with time.

