Fig 5.

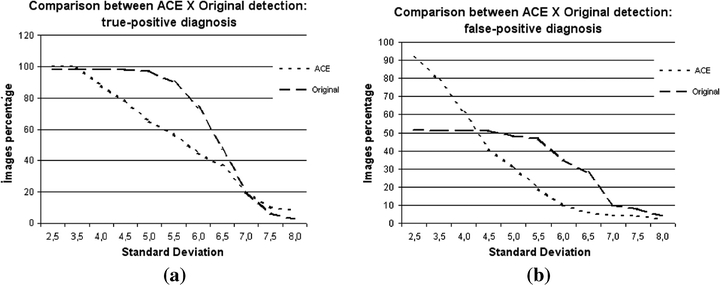
Graphics comparing the detections in original images and in images enhanced by the ACE technique: (a) percentage of true-positive detections, (b) percentage of false-positive detections.

Graphics comparing the detections in original images and in images enhanced by the ACE technique: (a) percentage of true-positive detections, (b) percentage of false-positive detections.