
Fig 4.
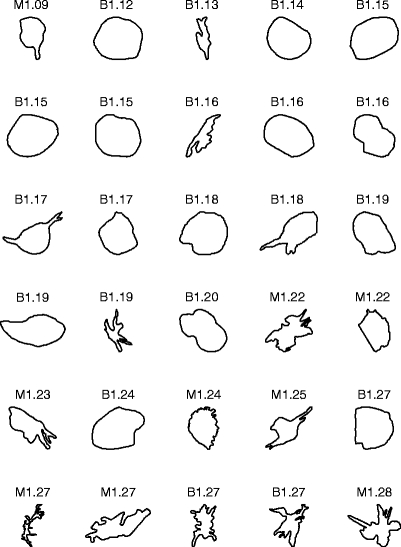
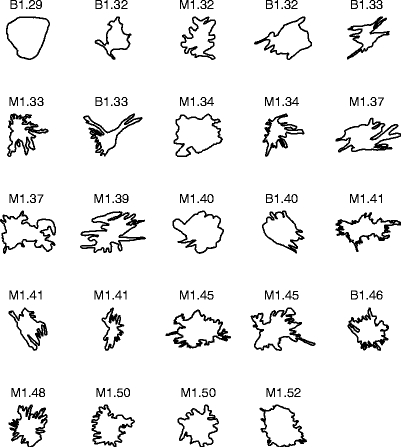
Contours of 28 benign masses and 26 malignant tumors in the second data set, ranked by their FD estimated by the 1D ruler method. The contours are of widely differing size, but have been scaled to the same bounding box in the plots. B: benign; M: malignant.