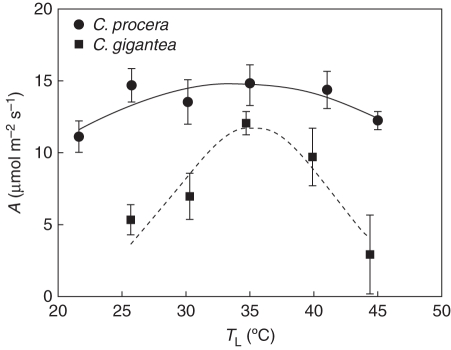
Fig. 3.
Response of photosynthetic rate to leaf temperature of Calotropis procera and Calotropis gigantea, as indicated, growing in the field during the wet season, WS. Values are means ± s.e. (n = 4); standard errors are shown when larger than the symbols. Measurements were done under a PPF of 1200 ± 70 µmol m−2 s−1 and ambient CO2 concentration of 370 µmol mol−1.

