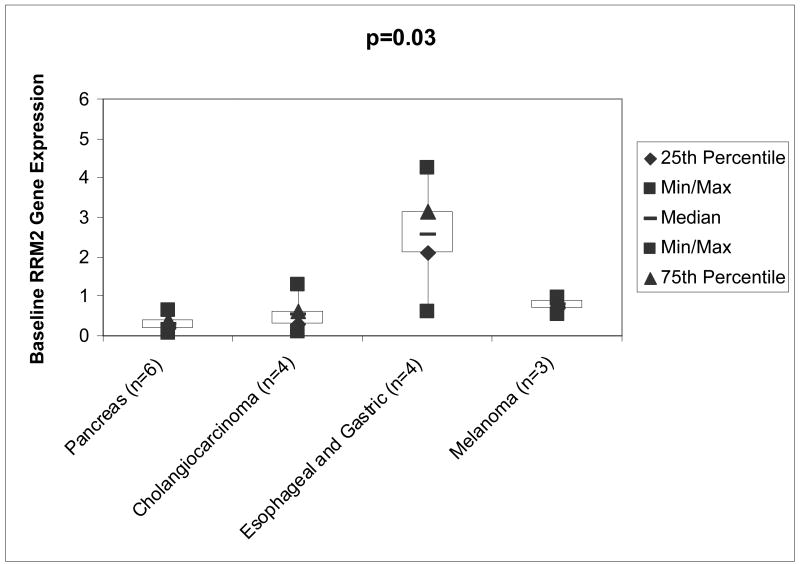
Figure 3.
Boxplot of RRM2 Gene Expression Evaluated by RT- PCR. The relative ribonucleotide reductase M2 gene expression for pancreas cancers (n=6) was 0.29± 0.20, cholangiocarcinoma (n=4) was 0.54 ± 0.52, esophageal and gastric (n=4) was 2.56 ± 1.49, and melanoma (n=3) was 0.79 ± 0.22. The p-values for the comparisons across all 4 tumor types is 0.03 (Kruskal-Wallis test), suggesting that at least one tumor type is different than the others. Abbreviations: RRM2, ribonucleotide reductase M2; n, number; Min, minimum; Max, maximum.

