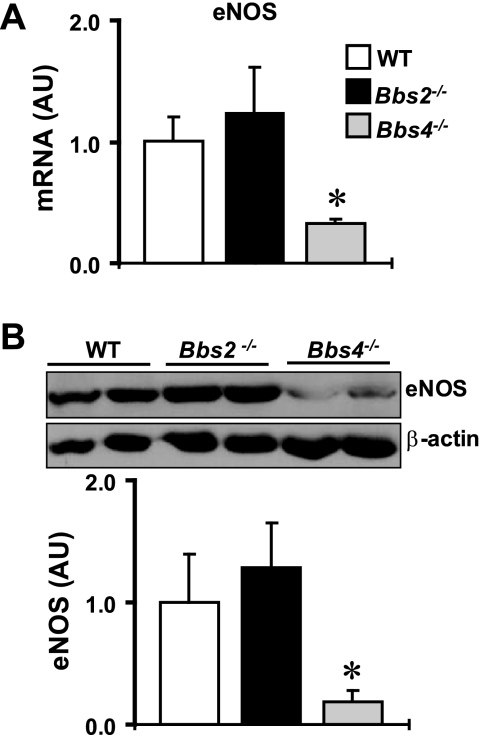
Fig. 3.
Expression level of endothelial NOS (eNOS) in the kidney of Bbs2−/−, Bbs4−/− mice, and WT littermate controls at the mRNA (by qRT-PCR; A) and protein (by Western blotting; B) levels. B: example of the Western blot assay is shown at top and quantification data at bottom. *P < 0.05 compared with WT mice; n = 4–6 per group.

