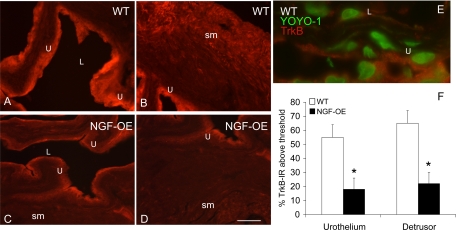
Fig. 7.
TrkB IR in urothelium (U) (A–D) and detrusor smooth muscle (sm) (B–D) of littermate WT (A, B) and NGF-OE (C, D) mice. TrkB IR was significantly (P ≤ 0.01) reduced in urothelial cells of NGF-OE mice (A, C). TrkB IR was also significantly (P ≤ 0.01) reduced in detrusor sm of NGF-OE mice (B, D). E: higher-power image of TrkB IR in urothelial cells in littermate WT mice. Trk staining was visualized with Cy3-conjugated secondary antibody (red areas). YOYO-1 identified nuclear profiles of urothelial cells and was visualized with Cy2-conjugated secondary antibody (green areas). L, lumen. Calibration bar: 50 μm (A–D), 30 μm (E). F: summary histogram of TrkB expression in the U and detrusor sm in WT and NGF-OE mice. Values are means ± SE for n = 5–7. *P ≤ 0.01.

