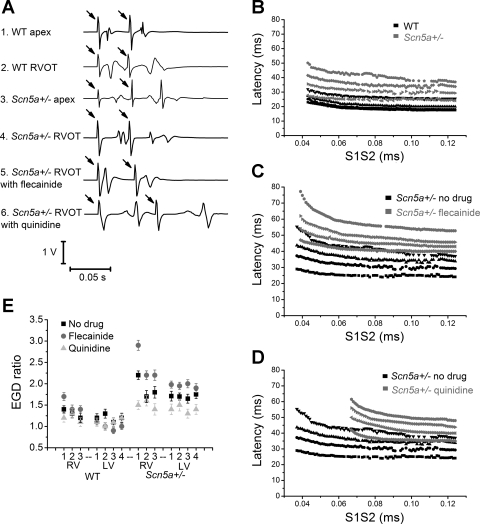
Fig. 2.
A: typical BEG traces from RV apex or RVOT of wild-type (WT) and Scn5a+/− hearts, either before drug or after treatment with either flecainide or quinidine. The arrows denote stimulus artifacts, the first in each trace from an S1 stimulus and the second from an S2 stimulus. B–D: comparison of conduction curves from the base of the RV in a WT heart and in an Scn5a+/− heart (B), and at the base of an Scn5a+/− heart before and after flecainide (C) or quinidine (D). E: electrogram duration (EGD) ratios calculated from WT and Scn5a+/− hearts in 7 positions across the heart, before and after the addition of flecainide or quinidine.

