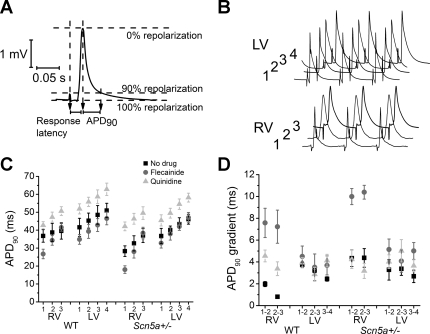
Fig. 4.
A: typical monophasic action potential (MAP) recording from the RV of an Scn5a+/− heart, showing action potential duration (APD) and latency measurements. B: typical MAP recordings taken from the 7 recording positions in the RV and LV of a Scn5a+/− heart. C and D: APD to 90% repolarization (APD90) values (C) and APD90 gradients (D) between 7 recording regions of the heart, in both WT and Scn5a+/− hearts, before and after the addition of flecainide and quinidine. In D, for example, “1–2” denotes the difference in VERP between recording positions 1 and 2.

