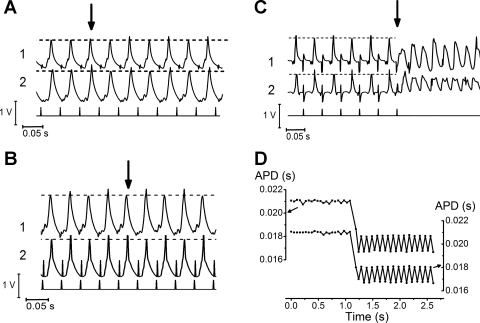
Fig. 5.
A–C: traces from the position RV1 and RV2 (labeled 1 and 2) of an Scn5a+/− heart first transitioning from regular action potentials (APs) to concordant alternans (A), from concordant alternans to discordant alternans (B), and from discordant alternans into VT (C). Transition points are arrowed. Dotted lines along the AP peaks are included to emphasize the change in morphology, although transition points were quantified in the form of APDs and not AP amplitudes. D: graph showing the transition from normal APs to alternans on changing to a shorter basic cycle length (BCL).

