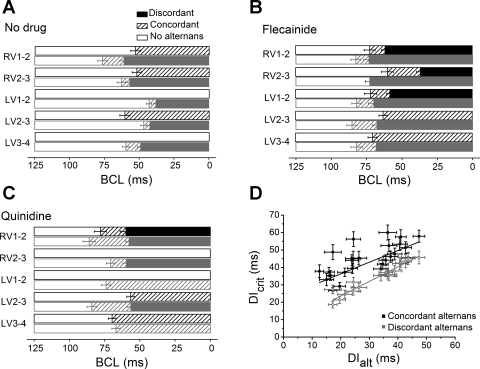
Fig. 6.
A–C: mean values of BCL at which hearts transitioned from normal APs (open bars) to concordant alternans (hatched bars), and then to discordant alternans (solid and shaded bars) both before drug (A) and after flecainide (B) or quinidine (C). Results from two simultaneous recordings of each of the adjacent regions in WT (solid bars) and Scn5a+/− (shaded bars) hearts are shown. D: critical diastolic interval (DIcrit) plotted against DI at which alternans commenced (DIalt), showing a relatively poor correlation between DIcrit and the initiation of concordant alternans (Pearson's correlation 0.70, P < 0.01), but a strong correlation between DIcrit and the initiation of discordant alternans (Pearson's correlation = 0.97, P < 0.01).

