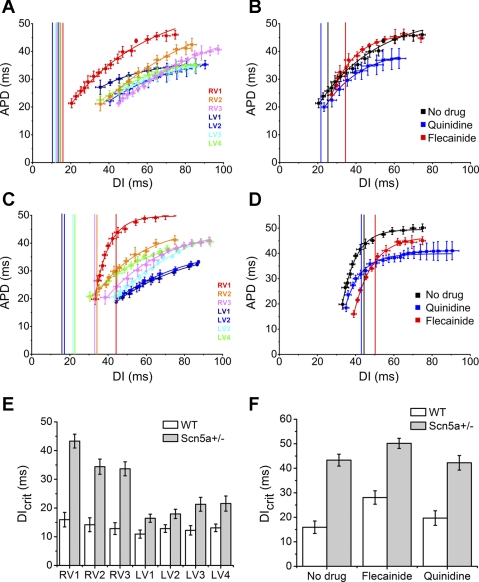
Fig. 7.
A–D: restitution curves, plotting APD against the preceding DI, from 7 regions in WT (A) and Scn5a+/− (C) hearts, and in RV1 before drug and after flecainide or quinidine in WT (B) and Scn5a+/− (D) hearts. The graphs are fitted with exponential functions, and from them the DIs at which the gradients equal unity (the DIcrit) have been calculated and are shown by the vertical lines. The results are shown graphically in the 7 regions of the heart (E) and in RV1 before and after flecainide or quinidine (F).

