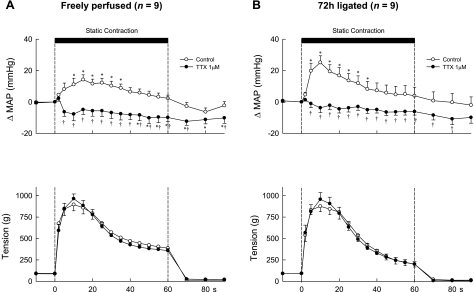
Fig. 2.
Temporal plots of the pressor responses and the tension development to static contraction in 9 rats whose hindlimbs were freely perfused (A) and in 9 other rats whose femoral arteries were ligated 72 h before the start of the experiment (B). Open circles, data points during the control period; filled circles, data points while TTX (1 μM) was applied to the pool surrounding the dorsal roots. Note that the first data point after the start of contraction (vertical broken line) was taken 2 s after its start, and every point afterward was taken at 5-s intervals from the start of contraction. *A data point for the change in mean arterial pressure (ΔMAP) was greater (P < 0.05) than its corresponding baseline value. †A data point for the change in mean arterial pressure was less (P < 0.05) than its corresponding control value.

