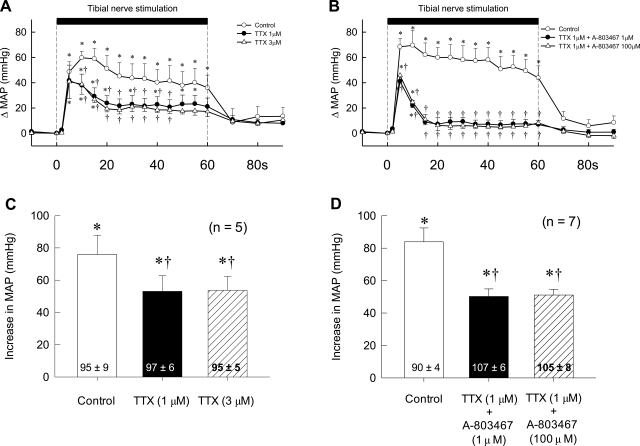
Fig. 6.
Effects of TTX and A-803467 applied to the pool surrounding the dorsal roots on the pressor response to electrical stimulation of the tibial nerve at current intensities that recruited group IV afferents. A: temporal plot of the effects of 1 μM TTX (filled circles) and 3 μM TTX (open triangles) in 5 rats whose femoral arteries were ligated 72 h before the start of the experiment. B: temporal plot of the effects of TTX (1 μM) plus A-803467 (1 μM) (filled circles) as well as the effects of TTX (1 μM) plus A-803467 (100 μM) (open triangles) in 7 other rats on the pressor responses to stimulation of the tibial nerve. Open circles, control responses in both A and B. Note that, in both A and B, the first data point after the start of stimulation (vertical broken line) was taken 2 s after its start, and every point afterward was taken at 5-s intervals from the start of stimulation. C: peak responses to electrical stimulation of the tibial nerve in the 5 rats shown in A. D: peak responses to electrical stimulation of the tibial nerve in the 7 rats shown in B. Values inside bars are baseline values. *The change in mean arterial pressure was greater (P < 0.05) than its corresponding baseline value. †The change in mean arterial pressure was less (P < 0.05) than its corresponding control value.

