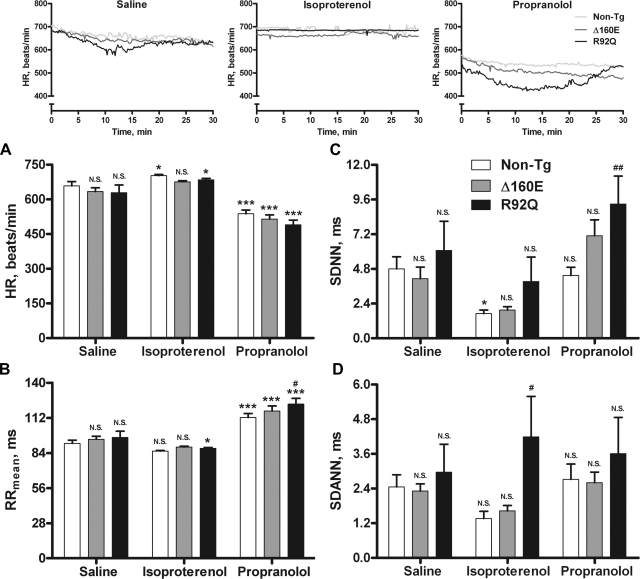
Fig. 4.
HR and time measures of HRV after saline, isoproterenol, and propranolol injections (n = 8 non-TG, 6 Δ160E, and 5 R92Q mice). A: HR. B: RRmean. C: SDNN. D: SDANN. The inset shows averaged representative HR recordings of non-TG, Δ160E, or R92Q mice over the 30-min segment after each saline, isoproterenol, or propranolol injection. Values are means ± SE. *P < 0.05 and ***P < 0.001 vs. the saline counterpart; #P < 0.05 and ##P < 0.01 vs. non-TG mice within drug groups.

