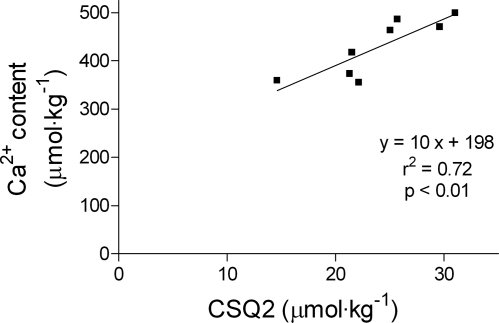
Fig. 4.
Correlation of total Ca2+ content and CSQ2 content in ventricular samples from hearts of 8 sheep. Ca2+ content was measured by atomic absorption spectroscopy, and CSQ2 content was measured by Western blotting as in Fig. 2; values/kg wet wt of muscle. Linear regression was performed, and r2, P value, and the line of best fit are indicated. The fit values were 10 ± 2.5 (slope) and 198 ± 60 (y-intercept).

