Fig. 6.
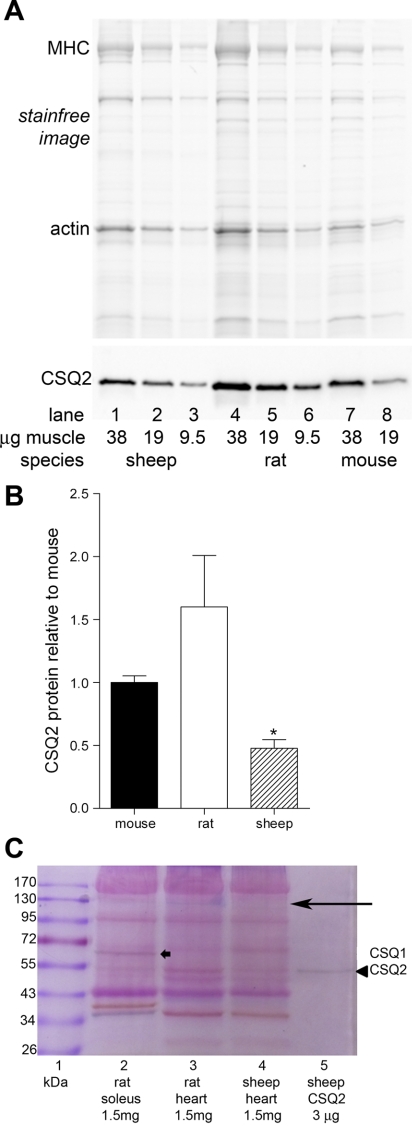
Comparison of CSQ2 amounts in sheep, rat, and mouse ventricular muscle. Homogenized ventricular samples (without any fractionation) separated on 10% (A) or 8% (C) SDS-PAGE. A: pretransfer Stainfree image of gel (top) and corresponding Western blot of CSQ2 (bottom) for indicated amounts (μg wet wt muscle) of ventricular tissue from sheep (lanes 1–3), rat (lanes 4–6), and mouse (lanes 7 and 8). B: relative amount of CSQ2 in ventricular tissue of different species found by Western blotting. CSQ2 band density for a given sample was first normalized to amount of tissue loaded (gauged by density of corresponding actin band on Stainfree image) and then expressed relative to the average for all mouse samples run on the same gel. Mean data were derived from 3 gels. *P < 0.05 different from rat, 1-way ANOVA, Newman-Keuls post hoc analyses. C: gel of separated proteins stained with Stains-all (see materials and methods). Purified CSQ2 was seen as a single dark band at ∼55 kDa (arrowhead in lane 5); a band was apparent at the same molecular mass in sheep and rat ventricular tissue and also in rat soleus muscle tissue. The blue band at ∼120–130 kDa (long arrow), most apparent in rat ventricular tissue (lane 3), is likely to be HRC. CSQ1 is seen as a dark band in soleus muscle at ∼63 kDa (thick arrow in lane 2). Molecular mass markers are on left (lane 1). An equal amount of unfractionated muscle tissue (1.5 mg wet wt) was loaded in lanes 2, 3, and 4, and 3 μg pure CSQ2 prepared from sheep heart were loaded in lane 5.

