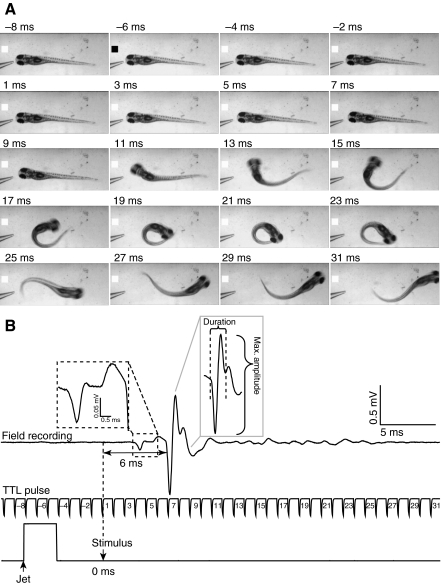
Fig. 2.
Large, phasic electric field potential generated during short-latency escape behavior. (A) Selected frames recorded during a representative fast escape response evoked at 5 d.p.f. are shown. The micropipette tip used to deliver the stimulus can be seen at the left side of each frame. The black square in the second frame indicates the start of the Picospritzer pulse. Time=0 ms (not shown) corresponds to the time the stimulus contacted the animal. (B) Electric field potential recorded during the escape response shown in A (top trace). The field potential delay (horizontal double-headed arrow) was measured as the time between arrival of the stimulus (downward arrow, 0 ms) and the beginning of the phasic component of the signal. The middle trace is the camera's TTL pulse, which is time-locked with the field potential recording. Numbers represent the frame time (ms) corresponding to images shown in A. The bottom trace indicates the time course of the Picospritzer water jet pulse. In this and subsequent figures, the upward arrow indicates the start of the water jet. The downward arrow indicates the time at which the stimulus contacted the animal (t=0 ms). Left inset: enlarged view of a small potential preceding the phasic potential. Right inset: the large, phasic component of the field potential signal. Brackets denote the duration of the phasic component and the maximum field potential amplitude measured from peak to peak. Results are representative of experiments using 20 control animals in which 350 stimuli were applied. Short-latency escape behavior was evoked in 190 trials.

