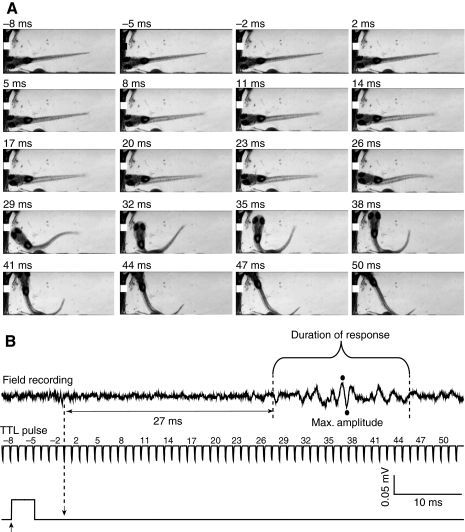
Fig. 4.
Small-amplitude, variable electric field potential generated during long-latency escape behavior. (A) Selected frames recorded during a representative slow escape response evoked at 5 d.p.f. (B) Electric field potential recorded during the escape response shown in A (top). The field potential delay (horizontal double-headed arrow) was measured as the time between arrival of the stimulus (downward arrow) and the beginning of the signal. The middle and lower traces are arranged and labeled as described in the legend to Fig. 2. The bracket denotes the duration of the field potential signal. The amplitude of the signal was calculated from the maximum and minimum values recorded (filled circles). Results are representative of experiments using 20 control animals in which 350 stimuli were applied. Long-latency escape behavior was evoked in 90 trials.

