
Fig. 5.

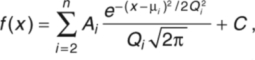
Bimodal distribution of escape behaviors. (A) Values of response latencies evoked at 3–5 d.p.f. were binned and plotted in histogram form. The data were fitted with the sum of two Gaussian functions using the equation:
(dashed gray line). This bimodal distribution defined short- and long-latency escapes with mean (±s.d.) latencies of 5.7±2 and 23±1 ms, respectively. (B) Changes in head trajectory were binned, plotted in histogram form and fitted as described in A. Filled and open bars correspond to short- and long-latency responses defined in A, respectively. Mean (±s.d.) changes in trajectory were 185.1±2.5 deg and 64.8±6 deg for short- and long-latency escapes, respectively, N=20 animals. In response to 350 stimuli, escape behavior was evoked in 280 trials. The remaining 70 stimuli failed to elicit escape behavior. Included in this category are trials in which the animal righted itself after being knocked over by the stimulus jet. Trials that did not result in escape behavior are not shown.
 |