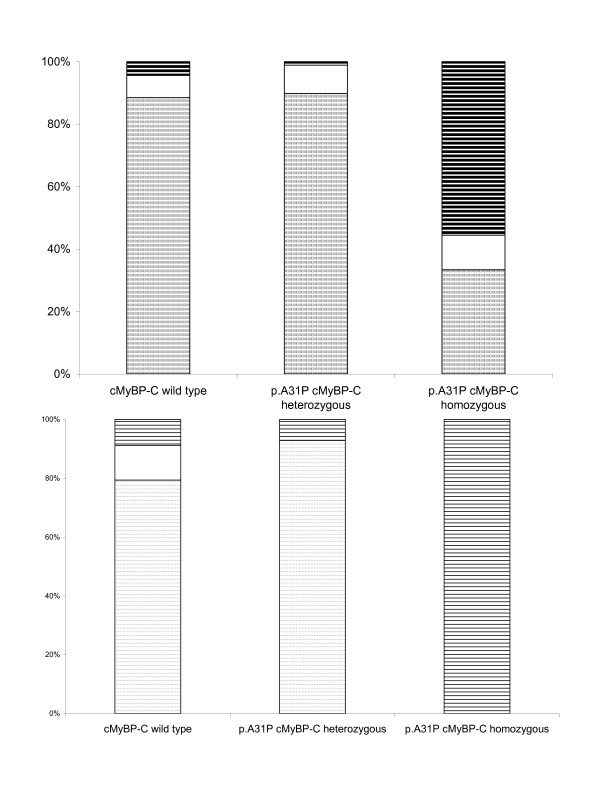
Figure 4.
Distributions of fHCM and equivocal cases in respect to p.A31P cMyBP-C genotype status. A: Histogram of the distribution for the entire cohort. The group of p.A31P cMyBP-C homozygous cats had an increased proportion of fHCM cases. B. Histogram of the distribution for cats over 4 years of age. Except for the homozygous the distribution was very similar to the distribution shown in A. Parts of boxes marked with small dots represent fHCM negative cats. Blank parts of the boxes indicate equivocal cases. Box marked with black stripes indicate cases of fHCM.

