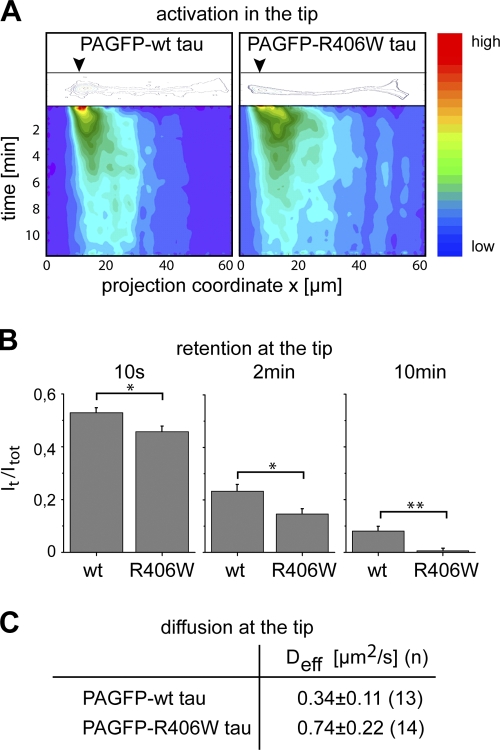
Figure 5.
R406W tau exhibits reduced trapping in the tip of neurites compared with wt tau. (A) Contour and color-coded plots of 2D intensity functions after photoactivation in the tip of representative processes expressing PAGFP wt and R406W tau. Position of activation is indicated by black arrowheads in the contour plot. Fluorescence intensity is color-coded from blue to red as indicated on the right. Note that the dissipation of fluorescence in the activated region occurs faster with R406W tau compared with wt tau. (B) Quantification of retention after focal activation of wt and R406W tau in the tip of neurites. Immobile fractions at different time points after activation (It/Itot) show decreased retention of R406W compared with wt tau. Values are shown as mean ± SEM (error bars). **, P < 0.01; *, P < 0.05 (n = 12–21). (C) Effective diffusion coefficients of tau after photoactivation at the tip of processes in PC12 cells stably expressing PAGFP wt tau or R406W tau. Values are shown as mean ± SEM with fits from n cells. Note the decreased Deff value corresponding to the increased retention of wt tau compared with R406W tau. Experiments were performed with the 352 tau isoform.

