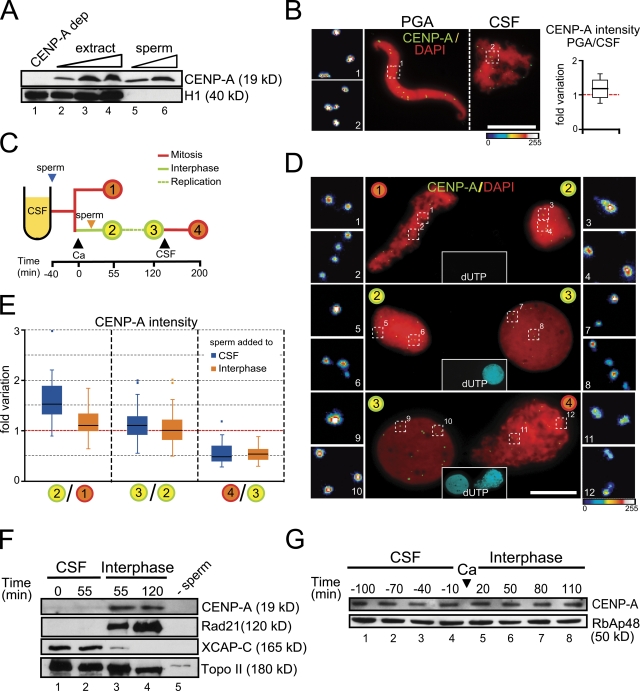
Figure 1.
CENP-A deposition occurs in early interphase in Xenopus egg extracts. (A) Sperm nuclei contain CENP-A. Immunoblot analysis of increasing amounts of egg extract (1, 2, and 3 µl; lanes 2–4), 3 × 10⁵ and 6 × 10⁵ sperm nuclei (lanes 5 and 6), and 1 µl of an extract depleted of CENP-A as control (lane 1). Unlike CENP-A, histone H1 is present in the soluble extract but not in the sperm nuclei. (B) Sperm nuclei were incubated with a buffer containing polyglutamic acid (PGA) or in CSF extract, mixed, centrifuged on the same coverslip, stained with anti-CENP-A (green) and DAPI (red), and imaged together. One representative pair of nuclei is shown. Bar, 10 µm. In the blown-up images on the left the intensity of the CENP-A labeling has been coded with a color gradient going from blue (minimum) to white (maximum). The intensity of CENP-A signals was measured for 15 pairs of nuclei and plotted as fold variation of the average signal for each pair. (C) Outline of the chromatin assembly experiment and the time points at which samples were taken for analysis. The time of calcium addition is considered t = 0. Black arrowheads indicate additions to the extract. The blue and orange arrowheads indicate the time of sperm addition in the two different experiments described in the main text. (D) Representative images of pairs of nuclei from two consecutive time points of the assembly reaction processed and analyzed together. Nuclei were stained with CENP-A (green) and DAPI (red). Replication was visualized by incorporation of biotin-dUTP (cyan, insets in the center). Bar, 10 µm. (E) Graph showing the fold variation of CENP-A signal intensities between two given time points (indicated by the numbers as in panel C) for two different time course experiments: blue boxes for the experiment in which sperm is added to CSF extract and orange boxes for addition of sperm in interphase extract. Data for each time point come from 15 pairs of nuclei in at least two independent experiments. (F) Immunoblot analysis of chromatin fractions obtained after incubation of sperm nuclei in CSF extract (lanes 1 and 2) or incubated in CSF for 40 min and then driven in interphase by addition of calcium (lanes 3 and 4). The times indicated correspond to the scheme in panel C. A mock assembly reaction without sperm DNA is shown as control (lane 5). (G) Immunoblot analysis of samples taken from an egg extract at the indicated times. The time of calcium addition is considered t = 0. The histone chaperone RbAp48 is shown as loading control.

