Figure 2.
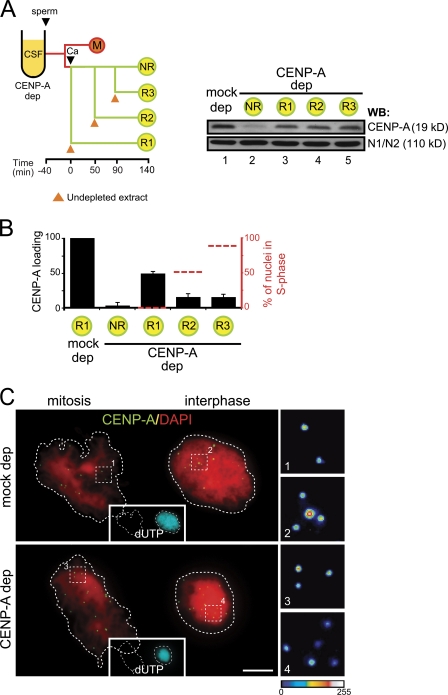
A window of opportunity for CENP-A loading in early interphase. (A) Outline of the chromatin assembly experiment (left) and immunoblot analysis of total extracts to show soluble CENP-A levels under the indicated conditions (right). The histone binding protein N1/N2 is shown as loading control. Sperm was added at t = 0 to CSF extracts (mock depleted or CENP-A depleted). For the mock-depleted extract, one-half volume of undepleted interphase extract was added at the time of calcium addition. For the CENP-A–depleted extract, either no extract was added back (no rescue [NR] condition) or one-half volume of undepleted interphase extract was added at the times indicated (R1, R2, and R3). (B) Bar graph showing the CENP-A loading efficiency under the conditions explained above, with respect to the mock-depleted extract. A small sample of the assembly mixture was taken right before addition of undepleted extract to check the percentage of nuclei showing some incorporation of biotin-dUTP (i.e., undergoing replication, red dotted line) at the time of restoring CENP-A availability, although analysis of CENP-A incorporation was performed comparing CENP-A signals from fully replicated interphase nuclei (taken at t = 140 min) and mitotic chromosomes from images such as those shown in C. At least 15 pairs of nuclei were measured for each condition. Bars represent mean ± SE. (C) Representative images of a mass of mitotic chromosomes next to a replicated interphase nuclei stained with anti-CENP-A (green) and DAPI (red) taken from the mock-depleted (top) and CENP-A–depleted (bottom) samples. Replication was visualized by incorporation of biotin-dUTP (cyan). Bar, 10 µm.

