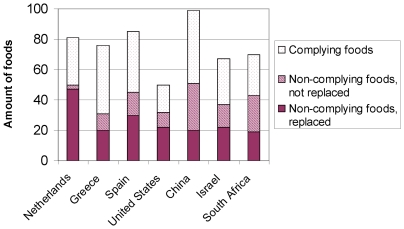
Figure 2. The amount of foods in the Typical Daily Menus.
Per country it is shown how many foods complied with the Choices criteria, as well as the amount of foods that did not comply: The non-complying foods are divided in those that were either replaced, when an alternative was available on the market, or not replaced.

