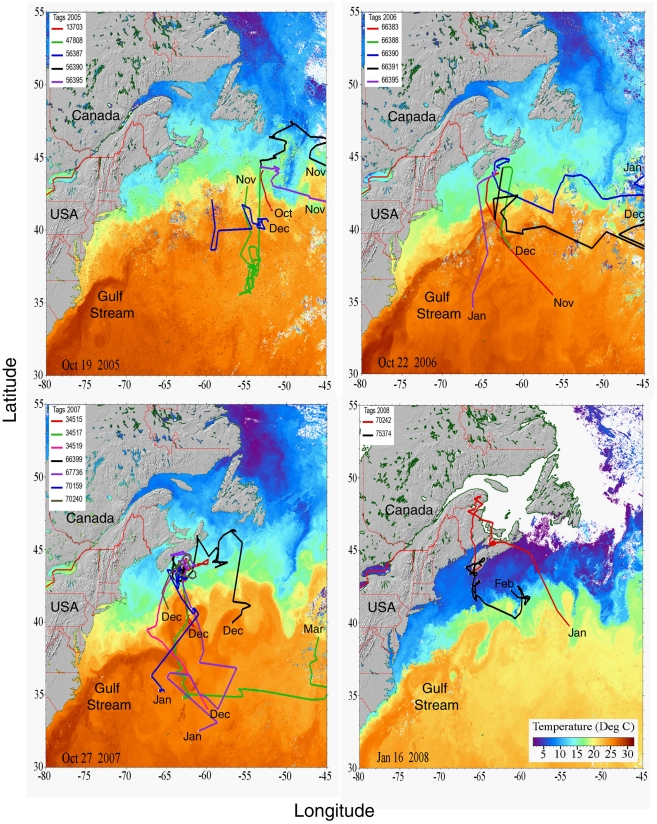
Figure 2. Blue shark migration pathways by year.
Reconstructed migration pathways (one colour-coded solid line per shark) of blue sharks tagged with PATs, overlaid on the SST satellite imagery on the date corresponding to their presence. Sharks not entering the Gulf Stream within 2 weeks of the date corresponding to the satellite imagery are not shown. Imagery date is shown in the lower left corner of each panel, and tag pop-up month is indicated at the end of each track. Tracks of tags 56390 and 56395 (2005), 66390 and 66391 (2006), and 34517 (2007) have been truncated by 0–2 degrees at the eastern edge of the SST imagery.

