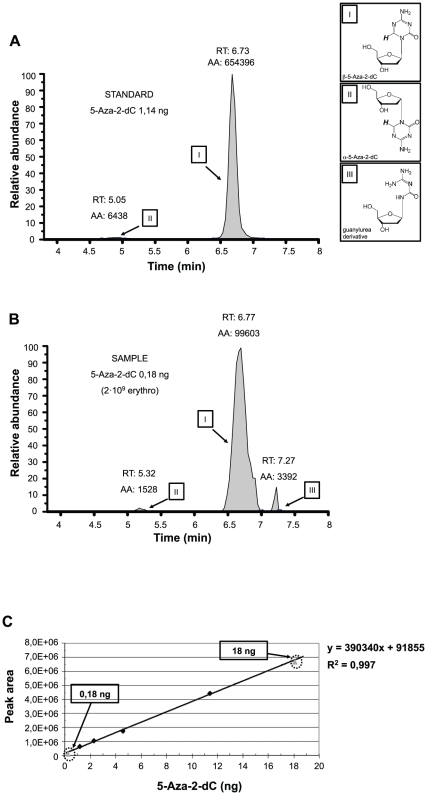
Figure 2. HPLC/QTOF quantitative analysis of 5-Aza-dC.
(A) Peaks of 1,14 ng 5-Aza-dC (standard). (B) Peaks of 5-Aza-dC encapsulated into 2×10⁹ erythro-magneto-HA virosomes. RT: retention time; AA: peak area counts. (C) Calibration curve of 5-Aza-dC. The peak area values of standards were put in relation with the ng/10 µl of 5-Aza-2-dC sample ran. Standard solutions used were 1,14, 2,28, 4,56 and 11,40 ng 5-Aza-dC (black rhombuses). Grey triangles show the 5-Aza-dC concentrations found within the two erythro-magneto-HA virosomes samples used in in vitro experiments.

