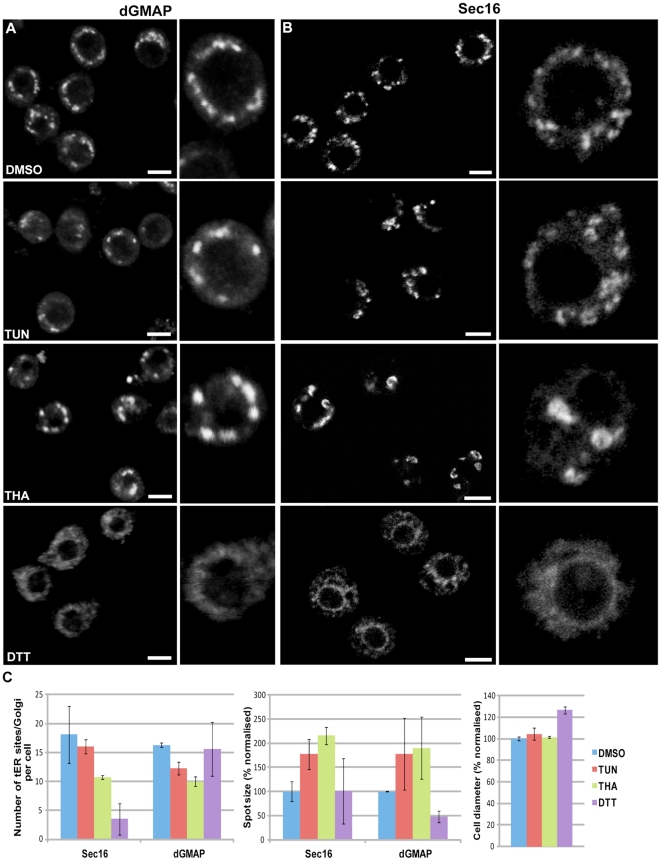
Figure 7. Induction of ER stress does not lead to a MG phenotype.
(A–B) S2 cells were treated with vehicle (0.1% DMSO), 10 µg/ml tunicamycin (TUN), 1 µM thapsigargin (THA) and 5 mM DTT for 24 h, fixed and processed for IF. Single labelling for dGMAP (Golgi, A) and Sec16 (tER site, B) was performed. Examples in high magnification are on the left. Note the (semi) circular structures labeled for Sec16 in THA- and to a lesser extent in TUN-treated cells, and the tER-Golgi unit enlargement in these cells compared to the controls. Note also the Golgi fragmentation/dispersal and Sec16 redistribution to the general ER upon DTT treatment. Pictures represent 2D projections of confocal sections. Bars: 5 µm. (C) Quantification of the number of tER (Sec16) and Golgi (dGMAP) spots per cell, their size and the cell diameter upon incubation with the different reagents for 24 h. The size of the fluorescent puncta and cell diameter are expressed as percentages normalized to the values of the control cells that were set as 100%. Note the significant decrease in the number of tER-Golgi units in THA- and TUN-treated cells and the increase in their size. Bars represent ±standard deviation.

