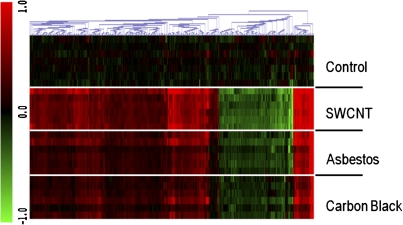
FIG. 6.
Heat map of peptide abundance (ratio of log2 (abundance) to control), by treatment group, for the 708 of 5458 peptides affected by one or more treatments. The overall pattern of changes in peptide abundance is remarkably similar across treatments, revealing broad similarities in the pulmonary response of the lung to the selected doses of SWCNTs, AB, and UFCB after repeated administration. Black, unchanged compared with control; green, decreased abundance; and red, increased abundance compared with control.

