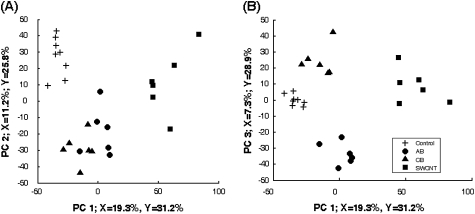
FIG. 9.
Scores plot from PLS-DA of 708 significant peptides. PLS-DA was used to determine if the peptide abundance data could be used to discriminate between treatments. SWCNT are separated on the first component, controls are separated on the second component (panel A), and AB and UFCB are separated on the third component (panel B). The PLS analysis indicates that the peptide data accurately distinguish between treatments, suggesting the presence of a unique biosignature for each material in the peptide data.

