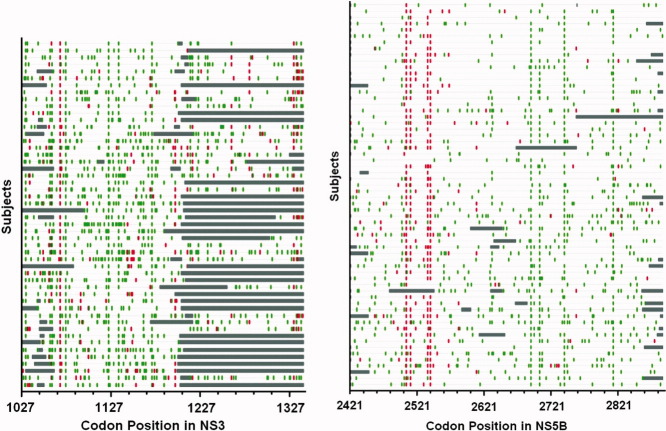
Fig. 1.
Highlighter plot of synonymous and nonsynonymous substitutions in NS3 and NS5B with respect to the source sequence (AF313916). The plot was created with Highlighter (available at http://www.lanl.gov). Red lines denote nonsynonymous substitutions, green lines indicate synonymous substitutions, and gray regions show unsequenced sections.

