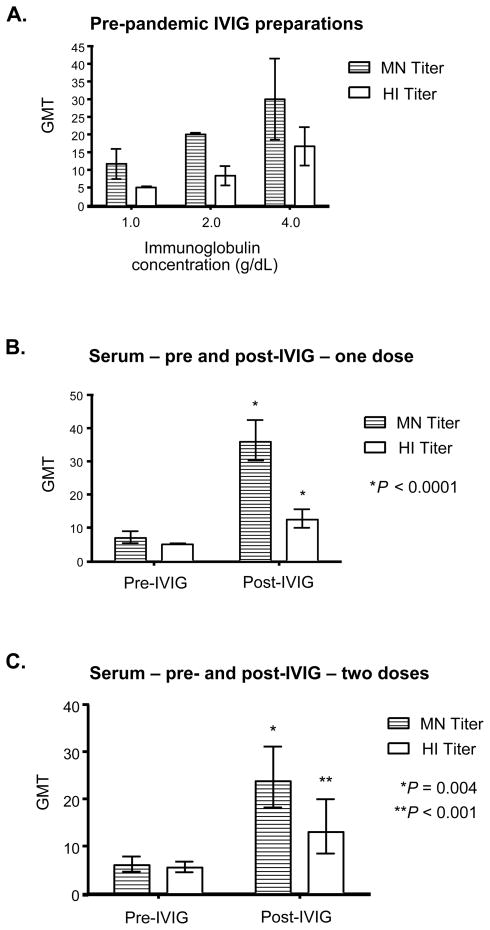
FIGURE 1.
(A) MN and HI antibody titers against 2009 H1N1 in commercial preparations of IVIG. GMT of MN and HI titers against 2009 H1N1 were determined at three different concentrations. Error bars represent 95% CI. (B) MN and HI antibody titers against 2009 H1N1 before and after treatment one treatment of 2.0 g/kg of IVIG are shown using serum samples that were drawn 1–3 days apart. Error bars represent 95% CI. P values were determined using the two-tailed, paired Student’s t-test with respect to the pre-IVIG sera sample from the same subject. (C) GMT for both MN and HI assays against 2009 H1N1 at baseline, and after two treatments of 2.0 g/kg of IVIG, are shown using serum samples that were drawn 5 to 13 days apart following the second dose. Error bars represent 95% CI. P values were determined using the two-tailed, paired Student’s t-test with respect to the pre-IVIG sera sample from the same subject.

