Figure 2. ROC resistance plots.

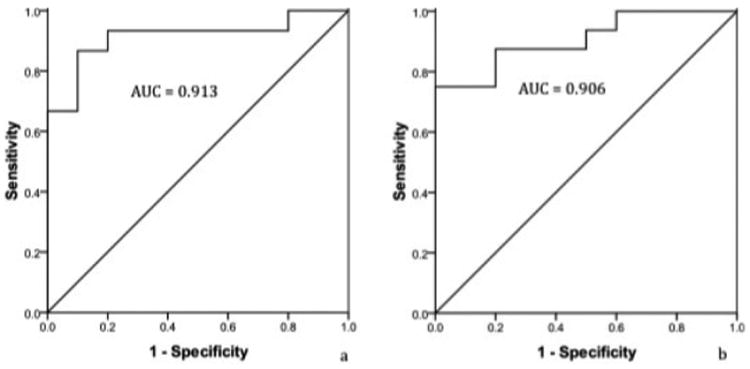
ROC plots of SCM resistance (A) and PS resistance (B). AUC, area under the curve or the accuracy of the test in discriminating normal subjects from CD patients.

ROC plots of SCM resistance (A) and PS resistance (B). AUC, area under the curve or the accuracy of the test in discriminating normal subjects from CD patients.