Fig. 5.
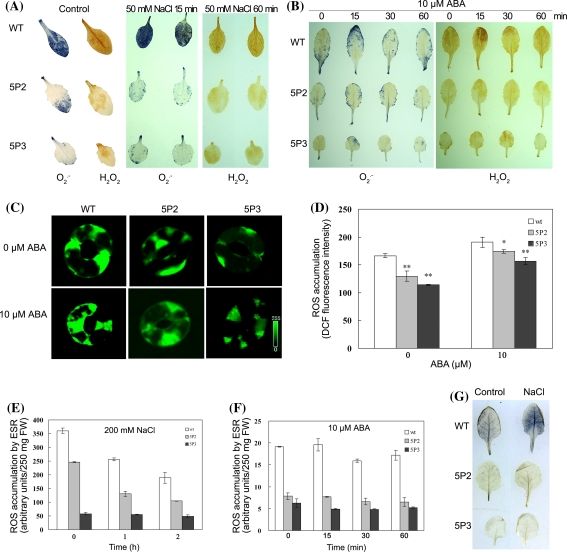
Constitutive expression of ABP9 decreases ROS levels and cell death in 35S-ABP9 transgenic Arabidopsis plants under normal growth, ABA and salt stress conditions. a, b Cellular levels of H2O2 and O2 ·− are reduced in leaves of 35S-ABP9 transgenic plants under normal growth (Control), salt (a) and ABA (b) conditions. Detached leaves from wild-type (WT) and transgenic plants (5P2 and 5P3) pre-treated with 50 mM NaCl or 10 μM ABA were stained with DAB and NBT to visualize H2O2 and O2 ·−, respectively. All experiments were repeated at least 3 times, and about 15 leaves collected from multiple seedlings (4–5-week-old) were inspected in each experiment. c Representative microscopy images of ROS production in intact guard cells indicated by fluorescent dye DCF. Epidermal peels were loaded with H2DCF-DA for 10 min after the incubation with 10 μM ABA for 2 h. The pseudo-color key is shown at the bottom of lower panel and applied to pixel intensity (0–255) for all fluorescence images. d Quantification of ROS production in guard cells in (c) of wild-type and 35S-ABP9 plants following ABA treatment. Data are from measurements of pixel intensity in whole cells determined that are treated with or without ABA in three independent experiments (means ± SD). For the wild type (WT), n = 93 cells without ABA treatment, n = 100 cells with ABA treatment; for 35S-ABP9 transgenic line 5P2, n = 125 cells without ABA treatment, n = 220 cells with ABA treatment; and for 5P3, n = 120 cells without ABA treatment, n = 140 cells with ABA treatment. Asterisks indicate significant differences between the WT and 5P2 or 5P3 plants (*P < 0.05, **P < 0.01, by Students t test). e, f ESR spin trapping detection of carbon-centered free radicals by PBN in wild type and 35S-ABP9 transgenic plants in response to salt (e) and ABA (f). Intensity of the ESR spectra signal in plants untreated and treated with 200 mM NaCl or 10 μM ABA was measured and expressed in arbitrary units. FW, fresh weight. Experiments were performed three times. Shown are means ± SD of three replicates from one experiment. All differences between the WT and 5P2 or 5P3 plants are significant at P < 0.05 using Students t test. g Cell death staining with Evans blue before (Control) and 60 min after the treatment of 50 mM NaCl. The experiment was repeated 3 times, and 10 leaves collected from multiple seedlings (4–5-week-old) were inspected in each experiment

