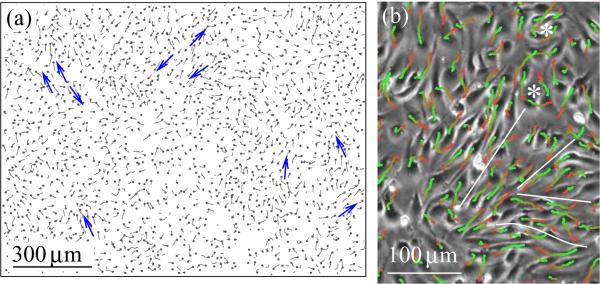
Figure 1.
Cell movement within a BAEC monolayer is visualized through cell trajectories. (a): A velocity field snapshot is indicated by short trajectories, obtained during 30 minutes. Cell centers are designated by black dots. Blue arrows show groups of cells moving together in streams. (b): A phase-contrast image detail with superimposed cell trajectories depicting movements during one hour. The average cell speed is 35 μm/h. Red-to-green colors indicate progressively later trajectory segments. Adjacent BAEC streams moving in opposite directions are separated by white lines, vortices are denoted by asterisks.

