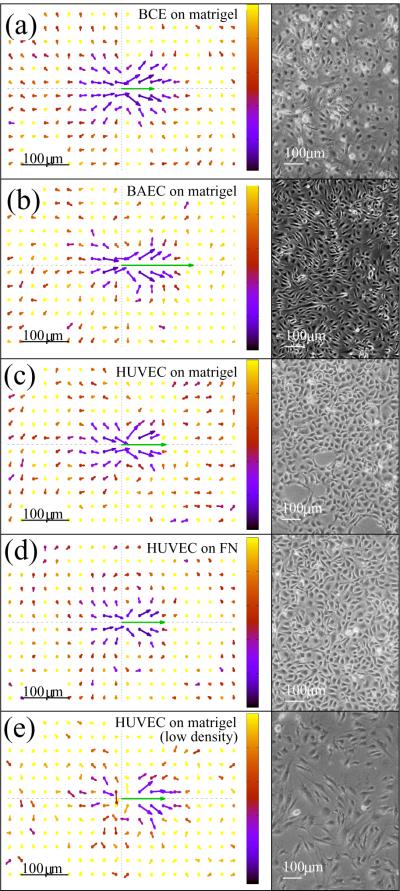
Figure 3.
Monolayers of various endothelial cells exhibit similar flow fields on both Matrigel and fibronectin substrates. The local spatial correlation of cell movements were characterized by V (x), the average flow field that surrounds moving cells. Arrows indicate velocities as one-hour-displacements, the green arrow in the origin represents the average velocity of cells. For better visibility, vector lengths are scaled by a factor of five. Cultures with sufficient density (a–d) show streaming behavior, indicated by the similarity of average velocity vectors obtained in front of and behind the moving cells. The co-movement drops rapidly in the lateral direction, an indication of the local asymmetry of the streams. In a subconfluent culture (e) the correlation structure is less pronounced. The color code indicates the estimated relative SEM of the vectors: black corresponds to zero, yellow indicates 1, i.e., a SEM equal to the norm of the vector. A corresponding phase-contrast image of the cultures are shown in the right.

