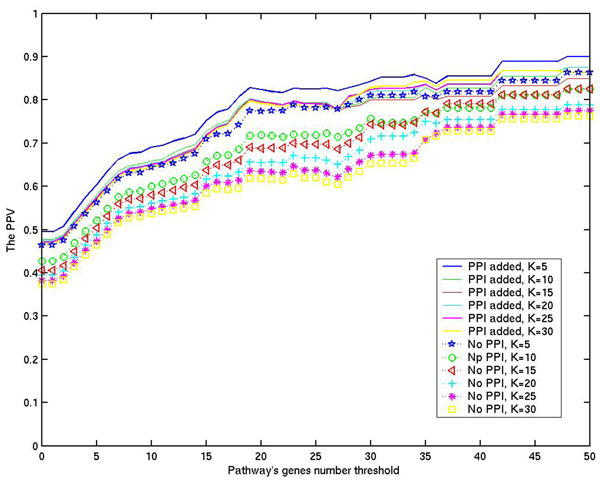
Figure 3.
The PPV rate based on a different number of pathway known genes. The average PPV rate of pathways P with |G(P)| ≥ x is calculated, and x is the threshold number, changed from 1 to 50. system(error) = 0.06, α = 380, β = 5, γ = 380, K is changed to 5, 10, 15, 20, 25, 30. (PPI: Phylogenetic Profile Information)

