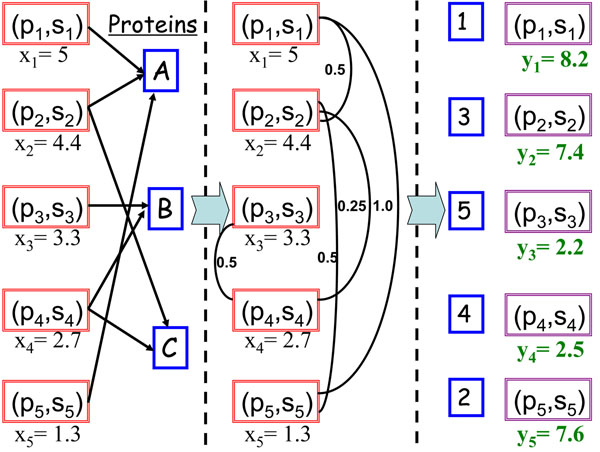
Figure 2.
An illustration of graph construction and PSM re-ranking. In this example, we have 5 peptide-spectrum pairs and 3 proteins (left). According to the peptide-protein relationship, we generate an affinity graph with 5 edges (middle). We use the proposed method to generate new ranking scores when λ is set to 0.6 (right).

