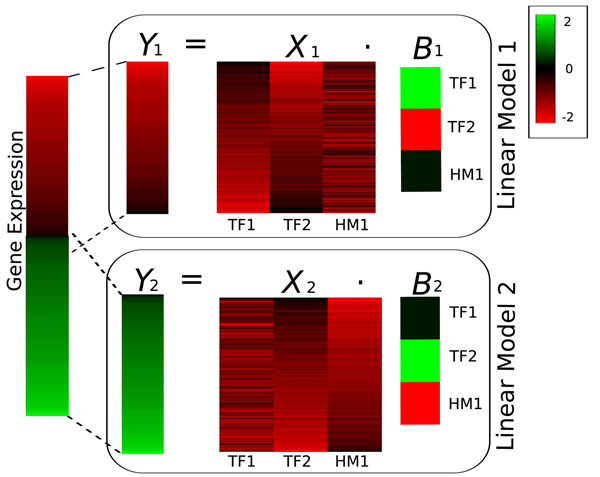
Figure 1.
Example of Linear Regression Mixture Model. Illustrative example of the use of linear regression mixture models to predict gene expression from the regulatory signals. Gene expression profiles, indicated by the heat map on the left (red and green correspond to highly and lowly expressed genes, respectively), are best predicted by two different models: model 1 for genes with high to medium expression and model 2 for genes with medium to low expression. At the level of each linear model k, the gene expression vector Yk is predicted by the multiplication of the matrix Xk (bright red values indicate higher TF binding strength or HM presence) with the vector of model coefficients Bk (red, black and green values indicate positive, near zero and negative regression coefficients, respectively). In this example, B1 indicates that genes with high to medium expression are repressed by TF1, positively regulated by TF2 and are unrelated to the presence of HM1. In contrast, B2 indicates that genes with medium to low expression are repressed by TF2, positively regulated by HM1, and are unrelated to the binding affinity of TF1. If we estimate a single linear model from the same data, TF2 would have a regression coefficient close to zero as the positive coefficient from model 2 and the negative coefficient from model 1 would cancel each other out.

