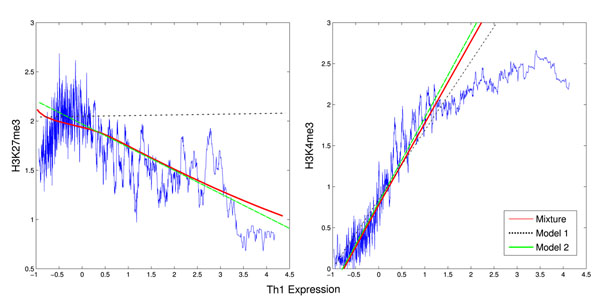
Figure 4.
Histone Modification against Th1 Gene Expression. We depict the values of Th1 gene expression against H3K27me3 modification (left) and H3K4me3 modification (right). The blue line represents a nearest-neighbor interpolation (30 samples) of the histone modification signal, the dashed black line represents the linear model for the 1 component, the green line for the 2 component and the red curve represents the mean regression value of the mixture of linear regression with 2 components. The interpolation indicates that the H3K4me3 is close to linear, but not for H3K27me3 modification, which is negatively related to high expressed genes, but has little effect on low expressed genes.

