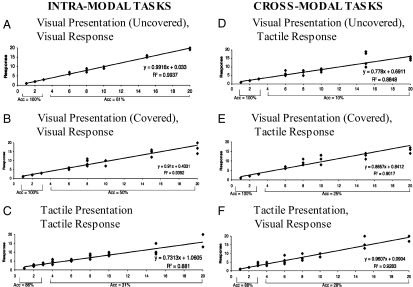
Fig. 4.
Number in noncommunicative tasks. The graphs display the homesigners’ responses on the six match-to-sample tasks: intramodal tasks (presentation and response in the same modality; A–C) and cross-modal tasks (presentation and response in different modalities; D–F). The function expressing the best linear fit is shown for each task.

