Fig. 3.
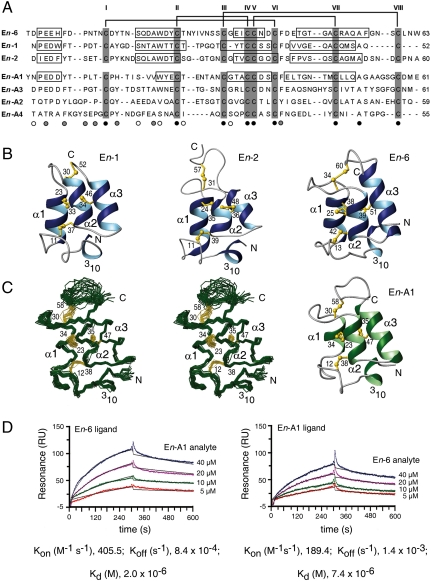
Structure and activity of E. nobilii pheromones. (A) Multiple amino acid sequence alignment between the sequences of E. nobilii pheromones of Antarctic (top three columns) and Arctic (bottom four columns) strains. The sequences were deduced from the respective coding nucleotide sequences (19), and their alignment was optimized by deliberate insertion of gaps. Positions that in this alignment are occupied by only one, two, or three different residue types are indicated below the En-A4 sequence by black, gray, and empty circles, respectively. The cysteines are shadowed and identified by Roman numerals progressing from the amino to the carboxyl terminus. The horizontal lines at the top indicate the disulfide bonds, which are common to both groups of pheromones. The boxes identify the locations of helical secondary structures in the four pheromones for which three-dimensional structures are available (20–22). (B) Ribbon presentations of the previously determined En-1, En-2 and En-6 pheromone solution NMR structures from the Antartic E. nobilii strains AC-1 and AC-4 (20, 21). The helical regions are highlighted in blue, regions of nonregular secondary structure in gray, and the disulfide bonds in yellow. The amino and carboxyl chain ends are indicated by N and C, respectively, the four helical structures are marked with 310, α1, α2, and α3, and the cysteine positions are numbered. (C) Newly determined NMR solution structure of the pheromone En-A1 [Protein Data Bank (PDB) entry 2KK2] isolated from culture filtrates of the Arctic strain 4Pyrm4 at natural isotope abundance. On the left, there is a stereo presentation of the polypeptide backbone (green) and the disulfide bonds (yellow) of a bundle of 20 energy-minimized DYANA conformers superimposed for minimal backbone rmsd of the residues 2–53. On the right, there is a ribbon presentation, characterized as in (B), of one of these En-A1 conformers. (D) Surface plasmon resonance measurements at 4 °C of protein–protein interactions between Antarctic and Arctic pheromones. In the sensorgram on the left, the pheromones En-6 (Antarctic) and En-A1 (Arctic) were used as ligand and analyte, respectively, whereas in the sensorgram on the right the roles were reversed. Four different concentrations of one pheromone were exposed to a sensor chip surface previously coated with the other pheromone during a 300-sec association phase and then removed by running buffer during a 300-sec flow dissociation phase. The two plots show the intensity of the signal in resonance units (RU) as a function of time. The curves obtained from the different injections of the analyte were superimposed using the BIA-Evaluation 4.1 software. Their fit was evaluated according to the Langmuir 1∶1 binding model, and for each analyte concentration the experimental and calculated curves are represented by colored and black lines, respectively. The plotted data represent differences in the RU signal between the flow cell (with the immobilized ligand) and the reference flow cell (without the ligand) and reflect specific ligand–analyte complexes, characterized by the kinetic and thermodynamic parameters reported at the bottom.

