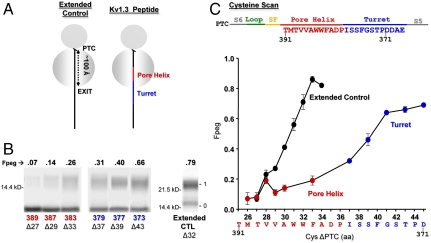
Fig. 2.
Probing secondary structure formation in the ribosomal exit tunnel. (A) Cartoons of two different nascent peptide–ribosome complexes. The gray circles represent the two subunits of the ribosome. The PTC, at the cleft between the two subunits, is approximately 100 Å from the exit port of the tunnel. An all-extended peptide (molecular tape measure) is represented by a solid black line (Left) and a nascent fragment of Kv1.3 containing the pore helix (red) and turret (blue) is depicted schematically as a solid line (Right). The native Kv1.3 peptide is attached to the PTC at residue A415 (SgrAI restriction enzyme). The complex is not drawn to scale. (B) Pegylation of the pore helix and turret. Nascent peptides were translated from mRNA engineered from a DNA that lacked a stop codon, pegylated (1 mM PEG-MAL for 4–6 h), and fractionated using SDS-PAGE as described in the SI Appendix. The number directly under each lane indicates the residue in Kv1.3 mutated to cysteine (pore helix residues in red, turret residues in blue); the number with a Δ indicates the number of amino acids from the PTC to (and including) the cysteine; the numbers to the left of the gel correspond to molecular weight standards; numbers to the right of the gel indicate unpegylated (0) and singly pegylated (1) protein; the number directly above each lane indicates the calculated fraction of nascent peptide pegylated (Fpeg). The rightmost lane is the all-extended control (Extended CTL). (C) Cysteine scan of the pore helix and turret of nascent Kv1.3 peptide. The x axis is the number of amino acids from the PTC to (and including) the labeled cysteine. Pegylation of a known all-extended nascent peptide, is shown by the black circles and represents data taken from Lu and Deutsch (5). The final extent of pegylation of individual residues in the pore helix and turret is represented by the red and blue circles, respectively. Symbols are mean ± SEM (n≥3).

