Fig. 4.
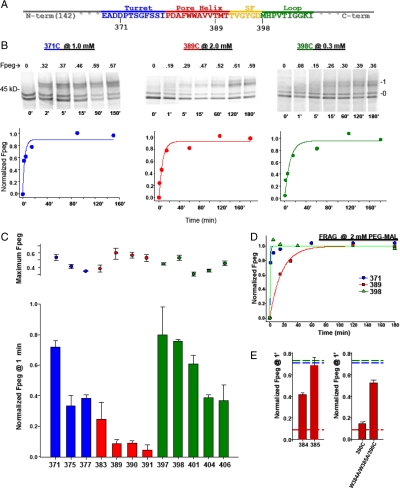
Relative pegylation kinetics of select cysteines in Kv1.3T1(-) and FRAG. Cysteines were engineered, one at a time, in each of three segments: the turret, the pore helix, and loop-S6, and pegylated. (A) The primary sequence of the pore region. (B) Pegylation kinetics of D371C (turret, blue), T389C (pore helix, red), and M398C (loop-S6, green) were determined at 1, 2, and 0.3 mM PEG-MAL, respectively. Each lane represents a sample quenched at the indicated time (below each lane, in minutes) and the number directly above each lane indicates the calculated Fpeg. Right and left numbers as in Fig. 2B. For each residue, a time course of normalized Fpeg is plotted below each set of gels and fit with a single exponential. (C) Normalized Fpeg at one minute in T1(-) for residues in the turret (blue), pore helix (red), and loop-S6 (green). The final PEG-MAL concentration was 2 mM in all reactions shown here. Identical pegylation reactions were quenched at 1 min and at > 3 h, fractionated using SDS-PAGE, and quantified as described in the SI Appendix. Pegylation at 1 min was normalized to the maximum fraction pegylated at > 3 h (maximum Fpeg, dot plot) and shown as Fpeg at 1 min (bar graph). Symbols are mean ± SEM (n≥3) for all residues except 377 and 397, which are mean ± average deviation for duplicate samples. (D) Time course of cysteine modification in FRAG. Cysteines engineered in the turret (371), the pore helix (389), and the loop-S6 (398) were engineered in the background of FRAG and pegylated (2 mM PEG-MAL), as described in Fig. 4B. Results were fit with a single exponential. (E) Cysteines were engineered in the pore helix at positions 384 and 385, each a tryptophan in the native sequence. (Left) W384C and W385C, separately, were pegylated (2 mM PEG-MAL) as described in Fig. 4B. Data are shown as Fpeg at 1 min normalized to the maximum Fpeg at 4 h. Values are mean ± SEM for n = 3. The red dashed line (derived from Fig. 4C) indicates a minimum Fpeg at 1 min for pore helix residues and the blue and green dashed lines (derived from Fig. 4C) indicate a maximum Fpeg value at 1 min for the turret and loop-S6, respectively. (Right) W384C and W385C were simultaneously mutated in the background of M390C and pegylated as described in Fig. 4B. The normalized Fpeg at 1 min for this triple mutant, W384A/W385A/M390C, is compared with M390C alone, and shown as mean ± SEM, n = 3, for M390C, and mean ± average deviation, n = 2, for the triple mutant. Dashed lines as described above for Fig. 4E, Left.

