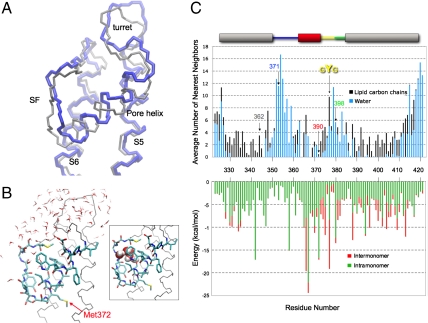
Fig. 5.
Stability of the reentrant pore loop. (A) Overlay of the monomer pore domain from the crystal structure of Kv1.2 (gray) and the pore domain at the 650th nanosecond of the molecular dynamics simulation (blue). (B) Snapshot of Kv1.2 pore domain at 650 ns. The pore helix and the selectivity filter backbone atoms (except O) and side chains, including Met372 (corresponds to Kv1.3 Met390), are shown. Waters within 4 Å of protein at 650 ns are shown. Pictures were prepared in the molecular viewing program VMD. (Inset) Same structure as in B, highlighting five water molecules between the pore helix and selectivity filter as space filling Corey–Pauling–Koltun atoms. (C, Upper) Average number of water and lipid heavy atoms around each residue. Number of water (blue bar) or lipid (black bar) heavy atoms (all atoms except for hydrogen) calculated within 4 Å of each heavy atom in each side chain and averaged throughout the 650-ns simulation. The bar along the top of the plot is color coded as described in Fig. 1 to indicate Kv segments. The numbers along the x axis are residue numbers of native Kv1.2. Tcl command interface of the VMD program were used to perform the analysis. Residues 346, 364, and 368 are probably surrounded only by protein (i.e., neither lipid nor water). The corresponding Kv1.3 residues 362 (S5, gray), 371 (turret, blue), 390 (pore helix, red), and 398 (loop-S6, green) are indicated by arrows, as is the GYG sequence (yellow). (Lower) The van der Waals interaction energies within a Kv1.2 monomer (green bars) and between one monomer and its three partner subunits in the tetramer Kv1.2 (red bars), both calculated from the Kv1.2 crystal structure.

