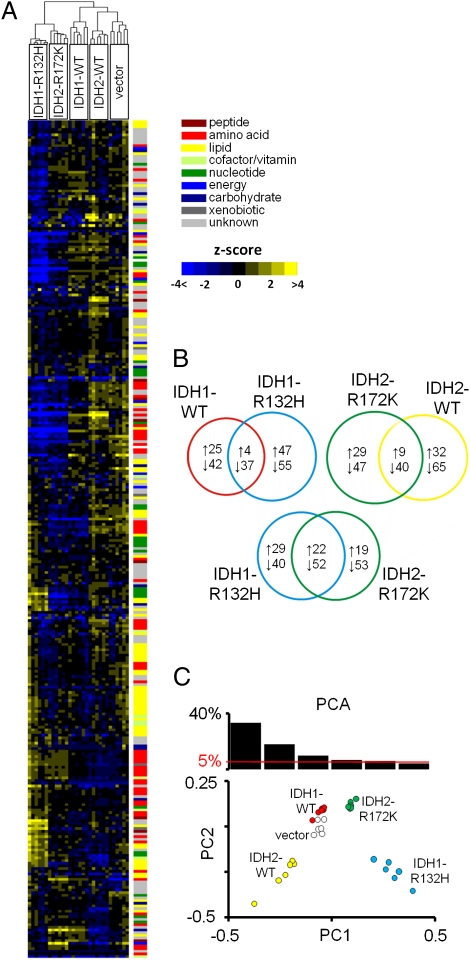
Fig 1.
Metabolite profile of a glioma cell line expressing IDH1-R132H or IDH2-R172K. (A) Heat map showing 314 biochemicals in lysates from six replicates each of HOG cells expressing IDH1-WT, IDH1-R132H, IDH2-WT, IDH2-R172K, or vector alone, arranged by unsupervised hierarchical clustering. The level of each biochemical in each sample is represented as the number of SDs above or below the mean level of that biochemical (z score). (B) Venn diagrams indicating the number of biochemicals with mean levels that are significantly (P < 0.05) higher or lower in cells expressing each transgene compared with the vector. (C) PCA of metabolite profile dataset. The percentage of variance in the dataset reflected by the first six PCs is shown in the histogram, and PC1 and PC2 for each sample are plotted.

