Fig. 1.
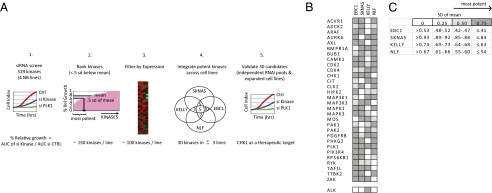
RNAi screen in neuroblastoma reveals a list of candidate kinase targets. (A) Schematic of the RNAi kinase screen in neuroblastoma. (1) Four neuroblastoma cell lines were treated with 529 kinase siRNAs and analyzed for substrate adherent growth. (2) Most active kinases of each cell line were ranked if the percentage of relative growth (AUC kinase/AUCctrl) was less than 0.5 SD of the mean percentage of relative growth for that line. (3) Kinases were further filtered for expression within their line. (4) Integration of the most potent kinases. (B) Thirty candidate kinases emerged as targets in three or more cell lines in the screen. ALK emerged as a candidate kinase in KELLY, the only ALK mutated line in the screen. (C) The percentage of relative growth of each cell line was divided by quartile within a cell line and represented as progressively darker boxes by increasing potency.

