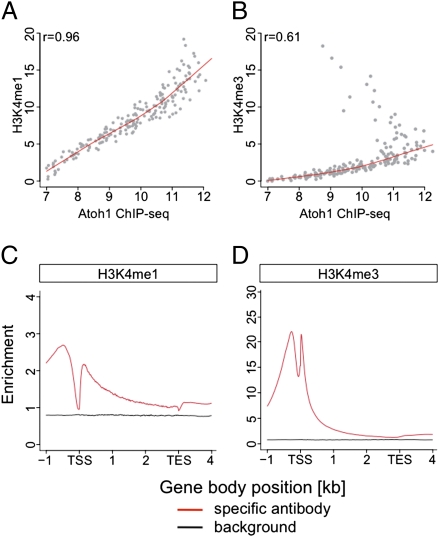
Fig. 2.
H3K4 ChIP-seq analyses. (A and B) Spearman rank correlation of the histone methylation levels (normalized peak intensities at the Atoh1 binding sites) with Atoh1 DNA-binding levels. Although the Atoh1 DNA-binding regions were less correlated to H3K4me3 (B), they possessed H3K4me1 marks (A). (C and D) Average ChIP-seq profiles for H3K4me1 (C) and H3K4me3 (D) in relation to the E18.5 transcript signature. The normalized read numbers per 10 million reads are shown in a 5-kb window, in which each detected transcript is normalized to 3 kb in length, with 1 kb upstream of transcriptional start site (TSS) and 1 kb downstream of transcriptional end site (TES). H3K4me1 marks are enriched over the entire region (C); H3K4me3 show two strong peaks, roughly one nucleosome up- and downstream of the TSS (D).

